
If you’ve never seen the movie “The Neverending Story,” you may not recognize this image — but our economy has become the Swamp of Sadness.
In the film, there’s a scene that stops children cold. A boy named Atreyu is crossing a dark, still swamp with his horse, Artax. The swamp has a property: it pulls sadness out of you. Not dramatically. Not all at once. It just slowly fills you with the weight of it, until you stop moving. And when you stop moving, you sink.
Artax stops. Atreyu screams at him. Pleads with him. Pulls at the reins. The horse doesn’t fight back. He doesn’t struggle. He just slowly, quietly goes under.
The scene is devastating because the horse didn’t fail. The horse was in a swamp.
That’s the image I want you to hold. Because the data I’m about to show you doesn’t describe an attack. It doesn’t describe a villain. It describes a slow pull — six directions at once — that has been working on American workers for forty-five years.
The gauges that are supposed to warn us — GDP, average wages, the unemployment rate — have been reading fine the whole time. But averages measure the whole table.
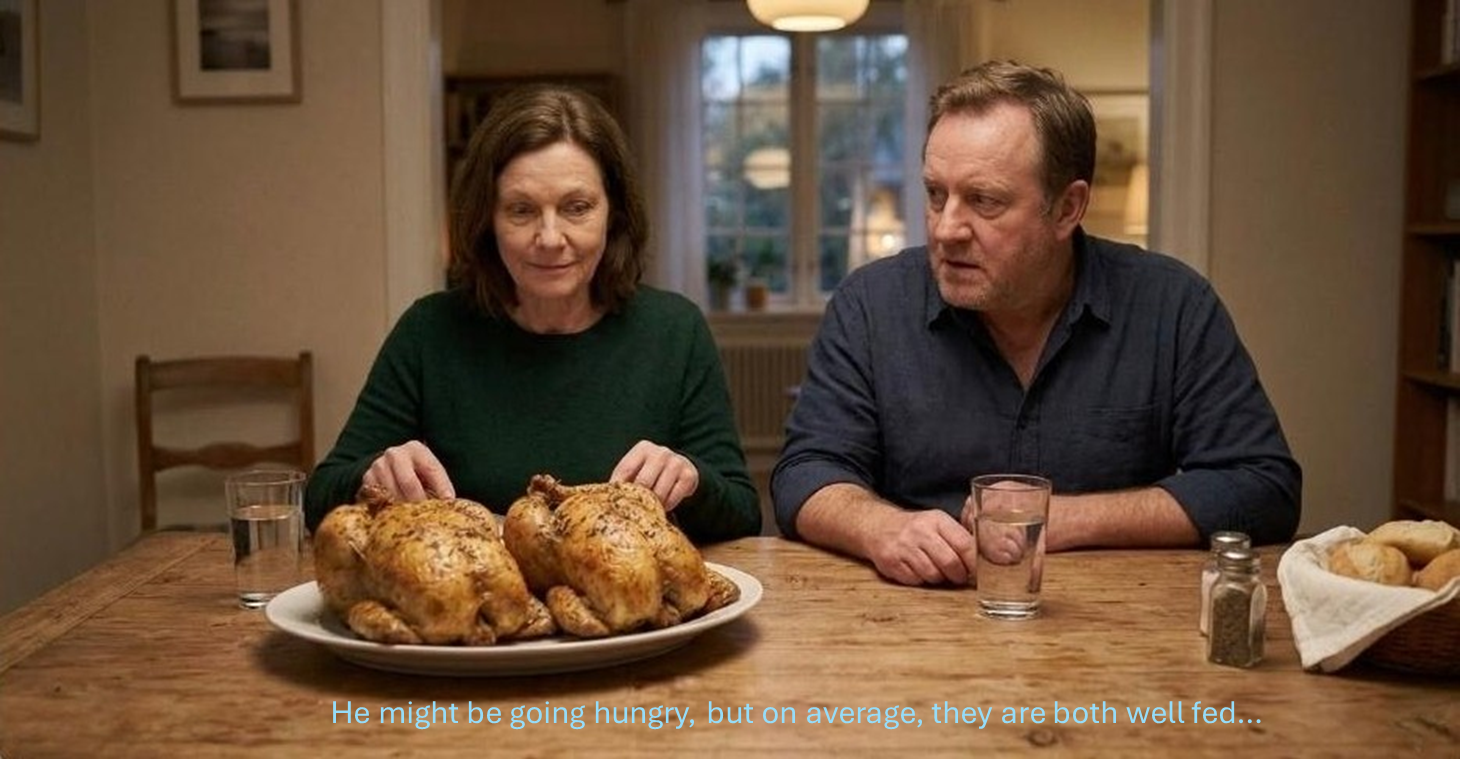
If two chickens are sitting in front of one person and nothing is sitting in front of the other, on average, everyone ate. The number is accurate. The distribution is the problem.
What the swamp is made of
There are six things a person needs to remain economically functional. Not comfortable. Not ahead. Functional — housed, fed, healthy enough to work, and able to get there.
Shelter. Food. Healthcare. Transportation. Utilities. A phone.
That’s the floor. Everything else is above it.
Housing costs have grown 140% since 1999 alone — while worker earnings grew 119% in the same period before inflation, and about 16% after it. Today, nearly 49% of all renters in the country spend more than 30% of their income on housing before they buy a single bag of groceries. That’s from the U.S. Census Bureau’s 2024 American Community Survey, and it’s a record high for the fourth consecutive year.
Healthcare premiums have grown 308% since 1999. Worker earnings in the same period grew 119%. Healthcare grew at nearly three times the rate of what people were paid to cover it. That gap doesn’t close on its own. It just gets carried — or it doesn’t.
Public transit fares have grown 378% since 1979. Overall inflation in the same period grew 332%. The thing you have to pay before you earn a dime outran the cost of everything else. At its peak in 2012, a transit fare sat 56% above where inflation alone would have put it.
Food costs have moved more slowly, but they’ve moved. Groceries are up roughly 26% since 2019 alone.
And then there’s communication — the one item that bent the other way. The price of telephone service has actually fallen about 5% since 1997. That sounds like relief. But the unit got cheaper while the bill didn’t. A 1990s landline has become a smartphone plan plus home broadband. You need both now to apply for a job, show up for a telehealth appointment, or help a child with homework. The price per unit fell. What the household must now buy grew.
Six essential basket items indexed to 1979=100. Healthcare +840%. Worker wages shown for scale. Sources: BLS CPI components; BLS CES.
Put it together: essential living costs have risen approximately 190% since 1979. Worker productivity — the actual output that funds everything — rose 90.2% in the same period. The cost of staying in the game grew roughly twice as fast as the economy’s ability to pay for it.
That’s not a recession. That’s not a crisis. That’s a swamp. It doesn’t announce itself. It just gets a little deeper every year.
What Artax looks like in real life
In 2023, the Census Bureau estimated that 342,000 Americans were living full-time in an RV, boat, or van — up 41% from 2019. About a third of them have children.
These are not people who fell off a cliff. They are people who stood still long enough in the swamp that the ground gave way. Median home prices are up 60% since 2019. Renters whose housing costs rose 38% since 2019 watched their incomes rise 28%. The math doesn’t resolve. It compounds.
The horse is in the swamp. The gauges say everyone ate.
What Atreyu looks like
In the film, Atreyu doesn’t drain the swamp. He doesn’t slay anything. He tries to pull his horse out — desperately, furiously, with everything he has.
The problem is that you can’t pull a horse out of a swamp one leg at a time. You need something structural. A rope. A plank. A mechanism that doesn’t require someone to keep screaming at the horse to fight.
The conversation worth having isn’t whether the horse is sinking. The data confirms that it is. The conversation is why we never built the rope — why we designed an economy on the assumption that wages and costs would track each other the way they used to, and never installed the thing that would make sure they did.
Before 1979, something kept them roughly aligned. Productivity grew at 2.5% a year. Compensation grew at 2.1%. They moved together — not perfectly, but close enough that the floor stayed under people. After 1979, the rates diverged. The gap compounded quietly for four decades. And the swamp filled in around the horse.
That’s not a political story. It’s a design story. The connection came loose. Nothing was built to hold it. The answer is an engineering job. Not a political one.